Impact of sampling and interpolation for time series
The raw data recorded when a change detected in the stream enables more realistic data recording comparison to time based sampling.Thus, sampling and interpolation required for most of the comparative analysis using time series, limit the usage of raw data for extended analysis.
However, you might wonder how it can distort the realistic nature of the data (except the probable anomalies) and leading to false interpretation.Lets focus on our theme.
For the analysis I am using few selected variables from water quality dataset recorded from Baffle Creek and Byrnett River.
First I will combine the two datasets into single dataset without sampling using panads merge function.
The Pearson Correlation Coefficient (PCC) calculated for the combined dataset and the heat-map of the results given below.
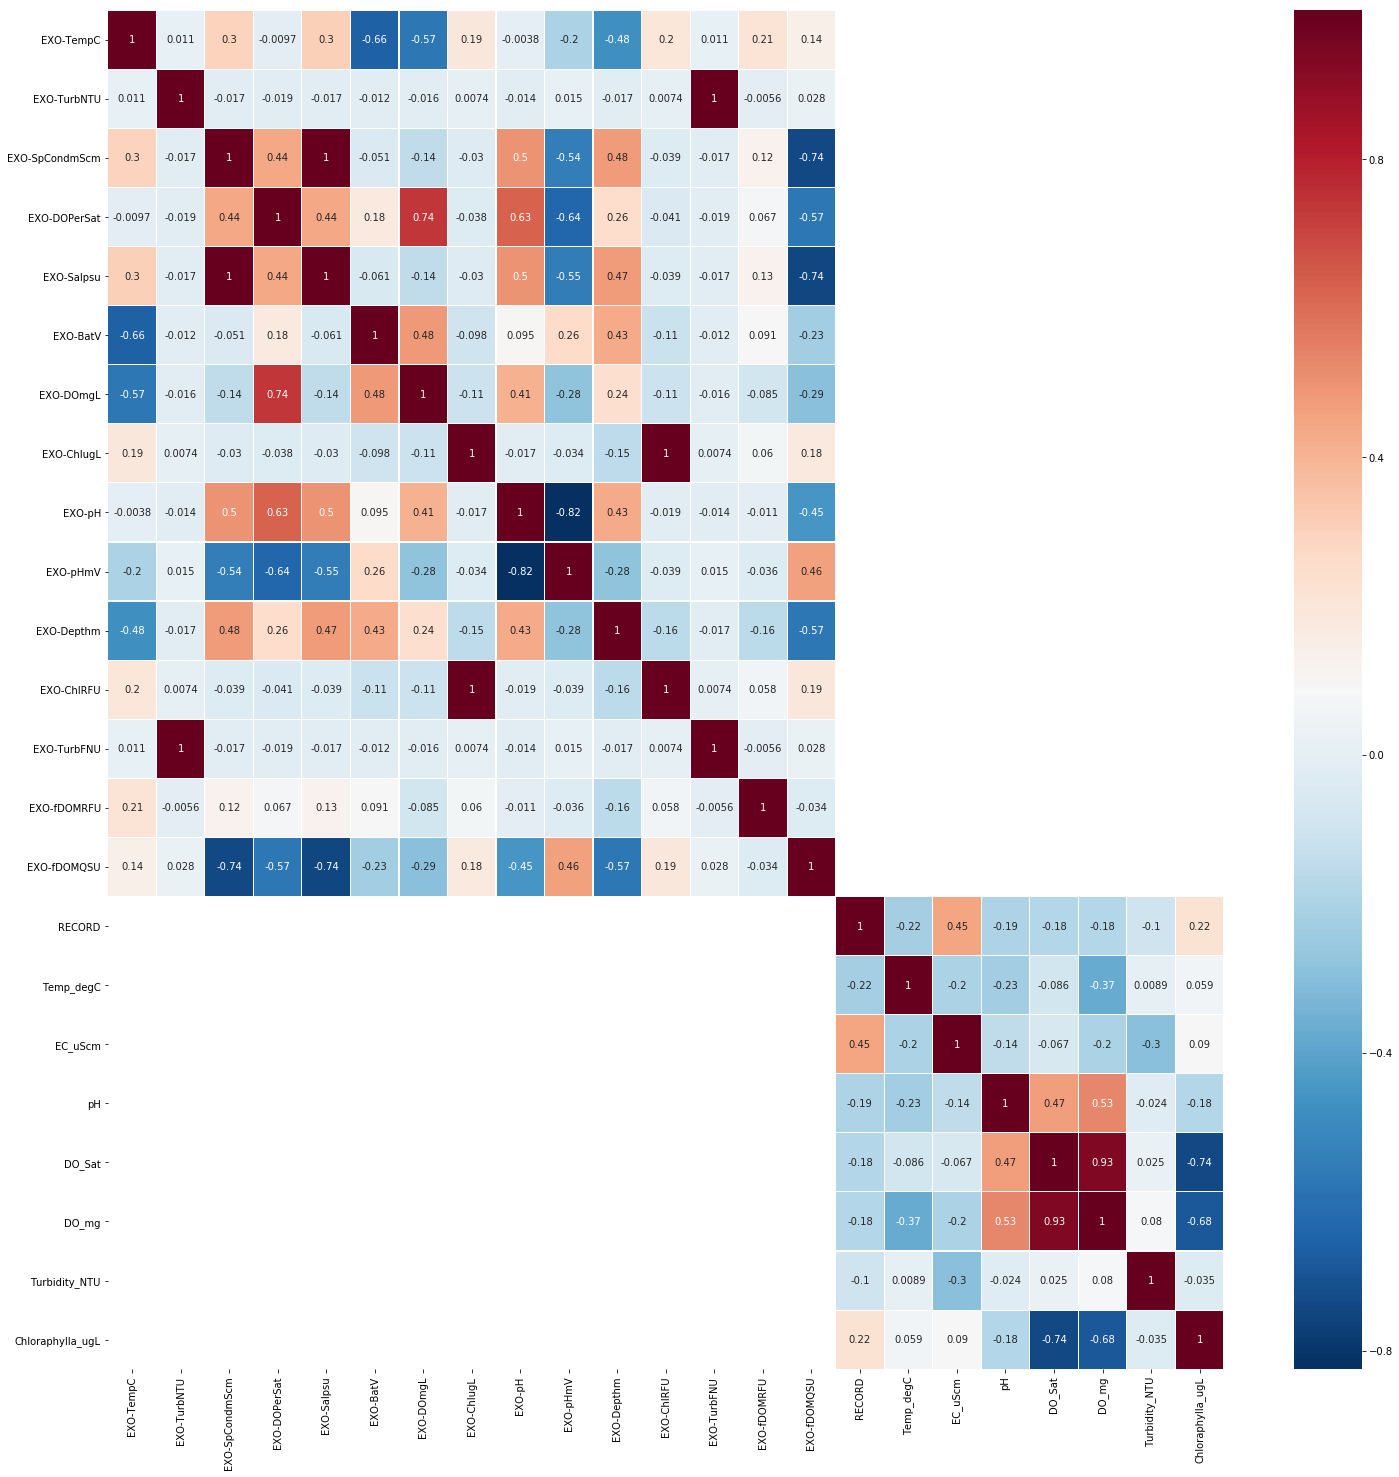
From the results, it is obvious that the two datasets may have correlations in-between the variable inside the dateset, thus, not within the two datasets.
In the next step, I have sampled both datasets to 10 minutes sampling rate which ensures there will be a record zero, 10 , 20 ,30 , 40 and 50 minutes of each clock hour.
The median or rolling window of 10 minutes calculated and generated values resampled at each 10 minutes within the clock hour.
The heat-map produced by the PCC of the sampled dataset withing every 10 minutes given below.

In the final step, I have sampled both datasets to 30 minutes sampling rate which ensures there will be a record zero and 30 minutes of each clock hour.
The median or rolling window of 30 minutes calculated and generated values resampled at each 30 minutes within the clock hour.
The heat-map produced by the PCC of the sampled dataset withing every 30 minutes given below.


Based on the visual comparisons between Figure one with Figure two and three it is clear that the sampling has generated a positive and negative correlations which are does not exist in the raw datasets. Furthermore, during the sampling process of 30 minutes, it has skipped more data from the raw dataset has signify the correlations between variables in between the datasets.
The usage of sampling or interpolation or sampled data collection is essential for comparative studies, thus utilizing them without sense tend to distort that data and provide misleading information to the audience.
Modern society rapidly shaping by the conclusions of scientific studies based on the data. It is important to further think about to which level data was manipulated by the authors specially in the context of time series data before believe on these conclusions.
Ready to play with data and code :) . Fell free to use Spyder Notebooks on GitHub repository.


Comments
Post a Comment